ChikDenZi - ArboWatch

Multi-source surveillance platform for critical Arboviruses

Chikungunya

Arboviral Disease Dashboards

Chikungunya
Dengue

Zika

Overview

Published literature, mapping, and recent news tracked together in one view.

๐Ÿ“„ PubMed literature โ€” all diseases
PubMed ยท sorted by publication current year
CSV

Interactive visualization of cumulative Chikungunya (2018-2025), Dengue(2019-2025), and Zika (2017-2024) cases reported across India.

๐Ÿ“ฐ Quick news
Google News ยท last 30 days
CSV
๐Ÿ”ฝ Filter by disease
Tap a pill to filter the news list above

About Us

Dr. Amit Sharma leads our research team at the International Centre for Genetic Engineering and Biotechnology (ICGEB), New Delhi. The lab brings together two collaborative research streams, united by a shared goal of addressing and understanding infectious diseases. The Structural Parasitology unit focuses on Plasmodium biology, mainly on molecular structures and pathways that play a crucial role in Malarial pathogenesis. Alongside, the Virus Research group explores the epidemiology and molecular mechanisms of Dengue, Chikungunya, and Zika viruses. Together, these multidisciplinary teams combine structural biology, molecular virology, and data-driven surveillance to advance public health and strengthen preparedness.

ChikDenZi Database represents a collaborative effort by our team members to enable real- time surveillance of vector-borne diseases such as Chikungunya, Dengue, and Zika. The database combines information on reported cases, outbreaks, associated mortality, and the country- and state-wise distribution of both vector and disease prevalence. All data have been carefully curated from NCVBDC, IDSP, and peer-reviewed literature, making it the first comprehensive resource of its kind in this field.

As part of the Wellcome Trust funded project

Title

Longitudinal characterization of clinico-epidemiological, genomic and immunological features of dengue and Zika infections and coinfections in Kerala, India: study protocol

Authors

Rahi, M., Rahul, A., Sharma, R., Saini, P., Shriram, A N., Rema Suresh, A., Thiruvengadam, K., Ramasamy, A., Raju, K H K., Veettilakath, J., Sugunan, S., Saheeda, T., Aravind, R., Chandele, A., Sharma, A., Anish, T S N.

Abstract

Introduction

The overlapping geographic distribution of dengue virus (DENV) and Zika virus (ZIKV), and their shared primary vector, facilitates co-circulation and coinfection or sequential infections in endemic regions. This overlap poses additional challenges due to immune cross-reactivity and the potential for altered or exacerbated clinical severity.

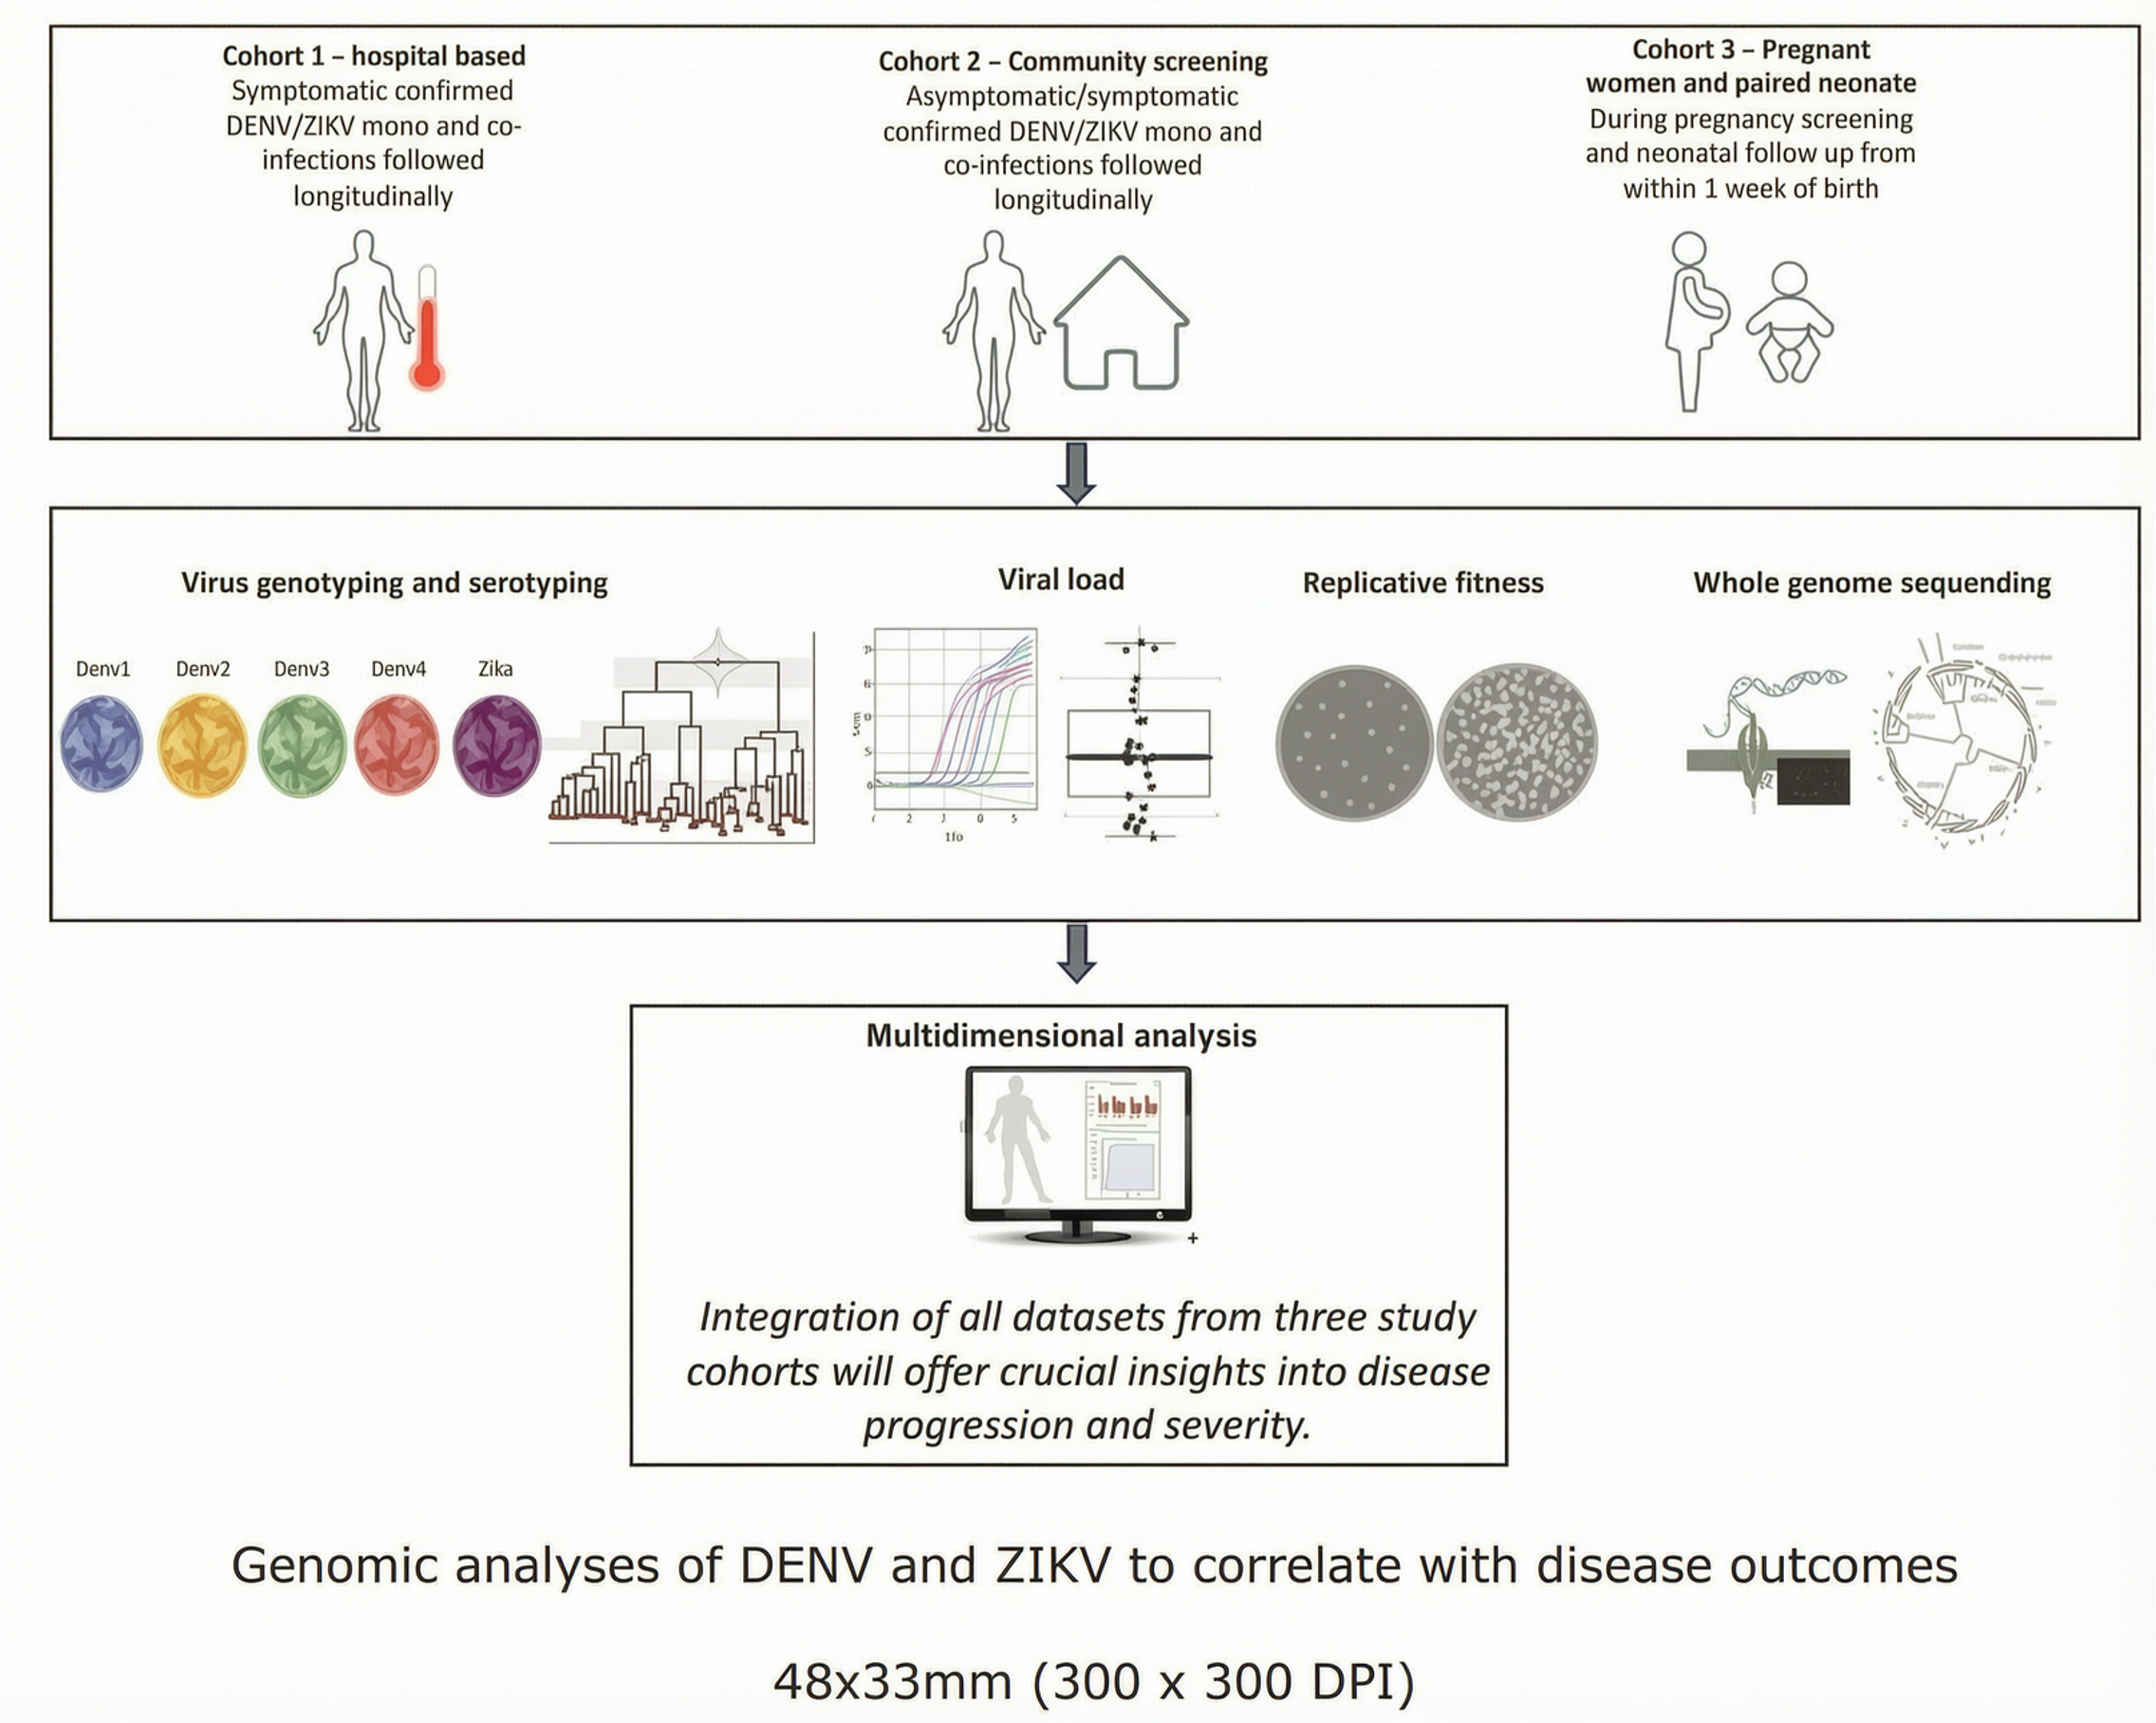
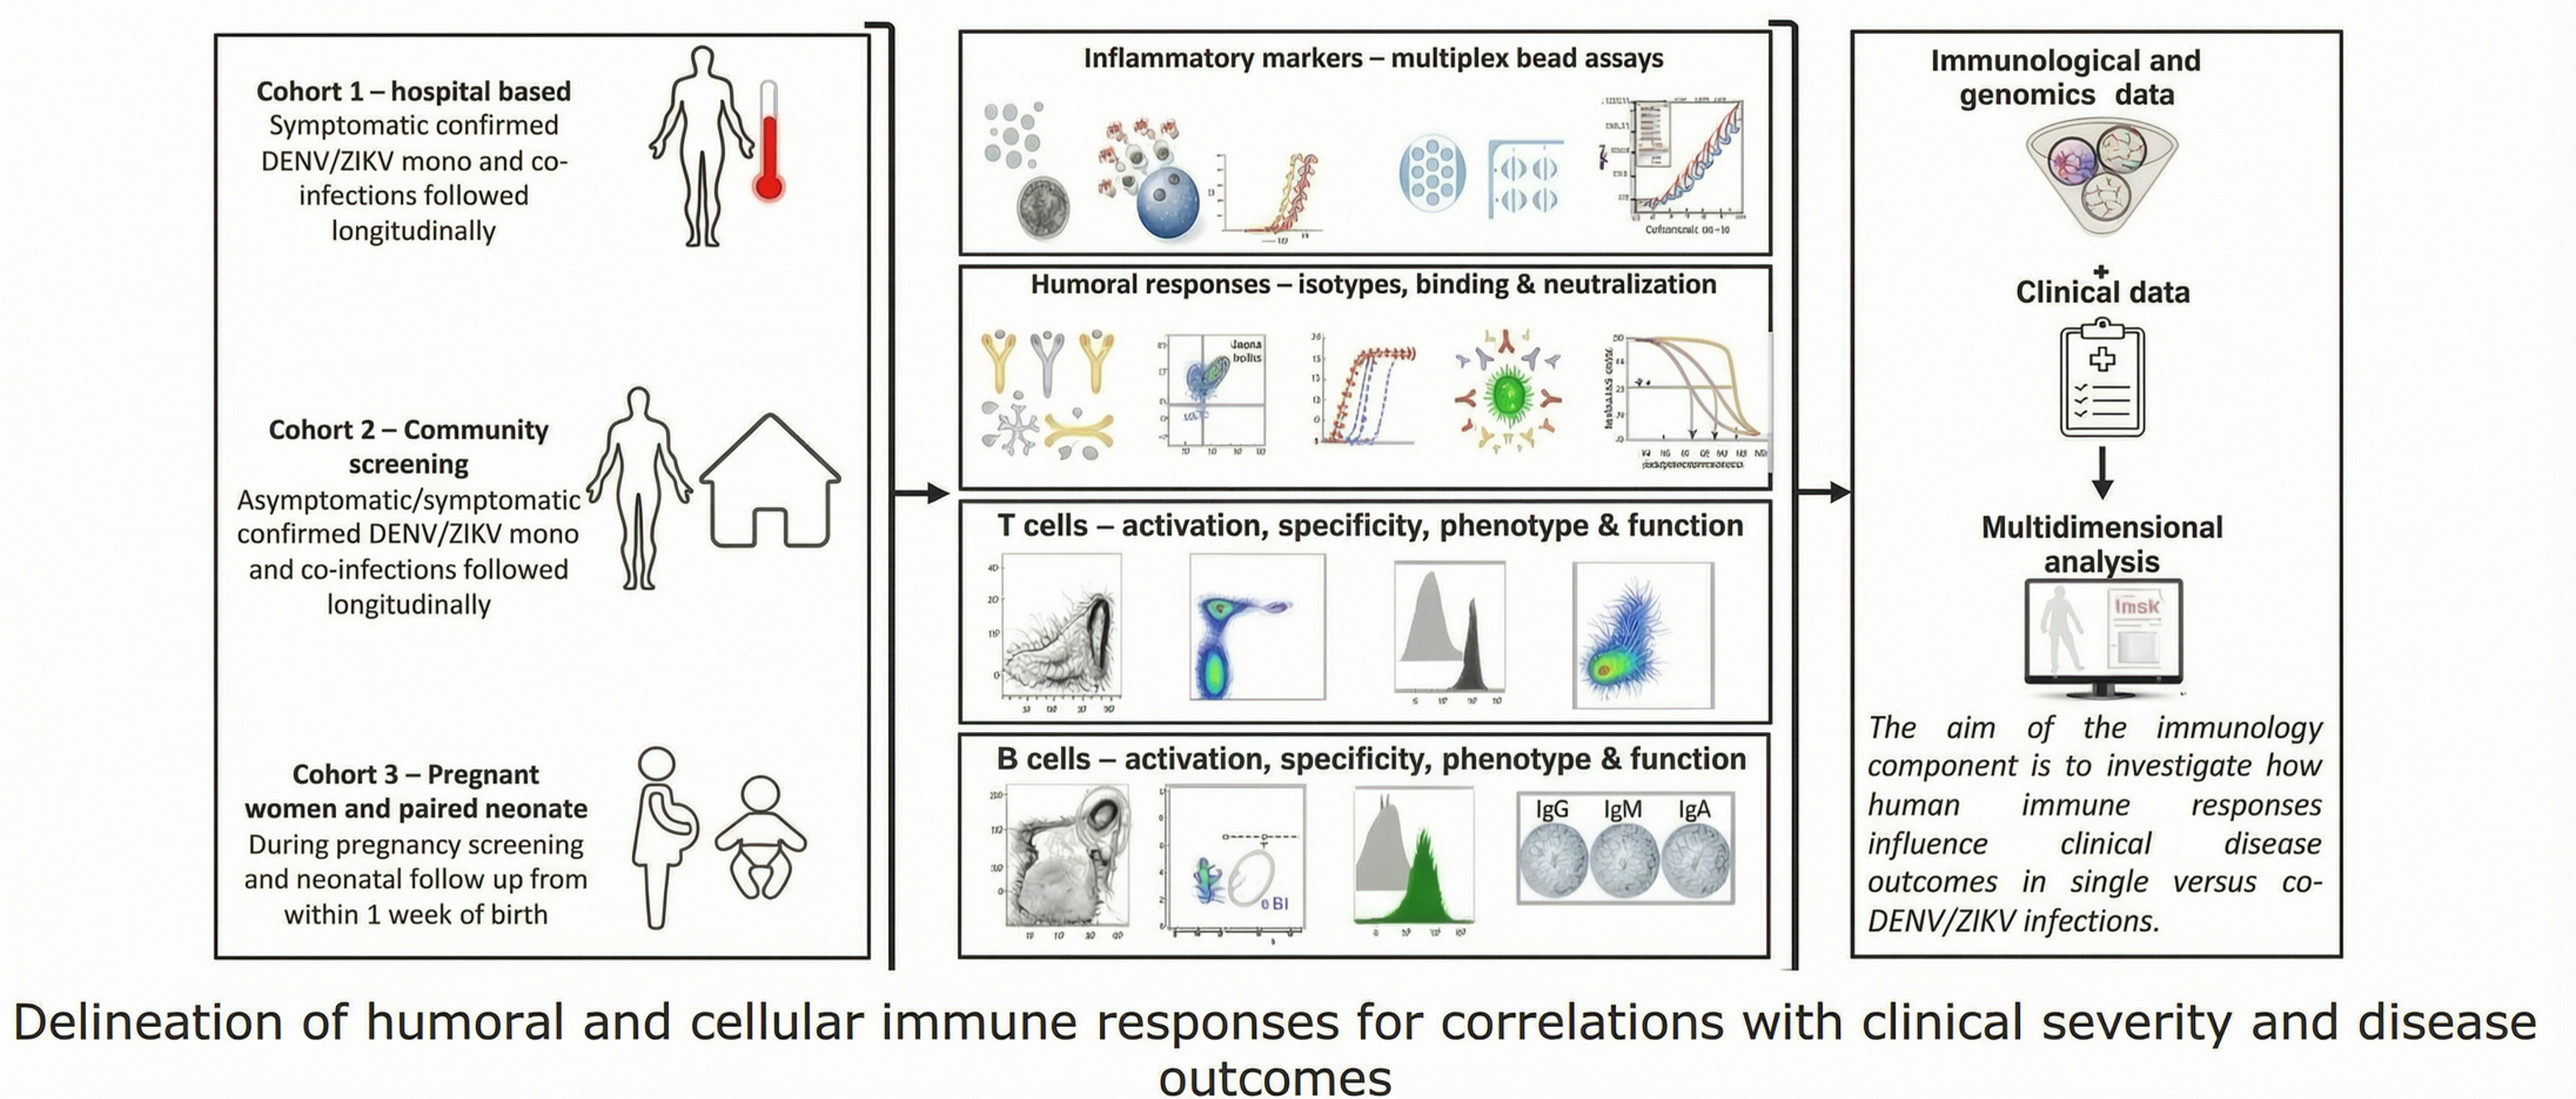
This study aims to estimate the burden of DENV-ZIKV infections and coinfections, characterise clinical and epidemiological profiles across adult, paediatric, and pregnant cohorts, assess viral genome diversity, and delineate humoral and cellular immune responses in relation to disease severity.

Kerala state in India, with robust surveillance, hyperendemic dengue transmission and documented ZIKV clusters, provides an ideal setting for this investigation.

Methods and Analysis

This longitudinal study will be conducted over a period of five years in the Thiruvananthapuram district of Kerala. Three cohorts comprising probable cases (~17,160 individuals), community clusters, and pregnant women (~10,400), along with their neonates, will be enrolled from public healthcare facilities.

Acute phase whole blood and/or plasma samples will be tested by RT-PCR for DENV and ZIKV, along with dengue serotyping and viral load quantification. Patients with confirmed infections will be followed longitudinally to evaluate clinical severity and disease outcomes.

Genomic characterisation will be performed using Nanopore whole-genome sequencing. Immune responses will be profiled using ELISAs, multicolour flow cytometry, and ELISpot assays.

Fortnightly surveillance of Aedes mosquitoes will be conducted in hotspot areas, combined with geospatial analyses. Multivariable regression and machine learning will be used to develop an integrative model to identify predictors of disease severity, adverse outcomes, and transmission risk.

Figures

Our Team

Dr. Amit Sharma

Team Lead

Dr. Syed Shah Areeb Hussain

Dashboard Designing

Dr. Pooja Rani Kuri

Analysis and Research

Pushparani Khwairakpam

Developer

Areeba Aziz

Data Collection

Anushka Dobhal

Data Collection

Prem Pandey

Data Collection

Contact Us

Contact Information

Address: Dr Amit Sharma Lab,
Group Leader, Structural Parasitology, Molecular Medicine Group,
International Centre For Genetic Engineering And Biotechnology (ICGEB),
New Delhi, Delhi 110067

Tel: +91-11-26741358 | 26742360 | 26741361

Email Address: admin@chikdenzi.com

Send Feedback


Academic Collaboration


Register
Verify your email address before creating your account.

Chikungunya Dashboard

NCVBDC Data
National Vector Borne Diseases Control Data
IDSP Data
Integrated Disease Surveillance Programme
Published Data
Reports & Publications
Geographic Distribution of Reported Cases
Loading...
Annual Reported Cases: NCVBDC vs IDSP
Loading...
๐ŸฆŸ

Disease Information

Chikungunya is a viral illness spread by mosquitoes, caused by the chikungunya virus (CHIKV), an RNA virus belonging to the alphavirus genus in the Togaviridae family. The term โ€œchikungunyaโ€ originates from the Kimakonde language of southern Tanzania and translates to โ€œthat which bends up,โ€ referring to the stooped posture of patients suffering from intense joint pain.

๐ŸฆŸ Vector-borne

Transmitted by Aedes mosquitoes

๐ŸŒ Geographic Spread

Tropical and subtropical regions

๐Ÿค’ Key Symptom

Chronic joint pain

๐Ÿค’

Clinical Symptoms

  • Most people who contract the chikungunya virus experience symptoms, which typically appear 3โ€“7 days after being bitten by an infected mosquito.
  • The hallmark signs are fever and joint pain, though other issues such as headache, muscle aches, joint swelling, and rash may also occur.
  • Certain groups are more vulnerable to severe illness, including newborns infected around birth, adults aged 65 and older, and individuals with underlying conditions like hypertension, diabetes, or heart disease.
  • While most patients recover within a week, joint pain can be intense, sometimes disabling, and may linger for months.
  • Fatal cases are uncommon.
๐Ÿ”ฌ

Etiology and Transmission

Global presence: Chikungunya virus is found across Africa, Asia, Europe, the Americas, and islands in the Indian and Pacific Oceans.

Virus family: It belongs to the alphavirus group within the Togaviridae family. Related viruses that cause similar illnesses include the Mayaro virus and the Ross River virus.

Transmission Patterns:

  • Infection occurs when mosquitoes bite an infected person and later feed on another individual.
  • During the first few days of illness, infected people have high levels of virus in their blood (viremia), enabling mosquitoes to pick it up and spread it.
  • Preventive measures include avoiding mosquito bites and receiving vaccination before travel, if recommended.
๐Ÿคฐ

Pregnancy and Breastfeeding

  • Rarely, the virus can pass from a pregnant woman to her fetus, most often during the second trimester.
  • If infection occurs near delivery, the baby may acquire the virus at birth (intrapartum transmission), which can sometimes lead to severe illness.
  • Chikungunya virus has not been detected in breast milk, and no cases of transmission through breastfeeding have been reported.
  • Women who are breastfeeding and either infected or living in areas where the virus circulates should consult their doctor.
๐Ÿฉบ

Diagnosis

  • Seek medical care if you develop symptoms after visiting areas where chikungunya is present.
  • Inform your healthcare provider about your travel history (locations and dates).
  • Tests can be ordered to detect chikungunya or rule out similar viruses such as dengue and Zika.
๐Ÿ’Š

Treatment

  • No specific antiviral medication exists for chikungunya.
  • Supportive care includes rest, hydration, and over-the-counter pain relief.
  • Acetaminophen (paracetamol) can help reduce fever and pain.
  • Avoid aspirin and NSAIDs (e.g., ibuprofen) until dengue infection is excluded, to lower bleeding risk.
  • Prevent mosquito bites during the first week of illness, as the virus circulates in the blood at this stage.
  • Mosquitoes feeding on infected individuals can transmit the virus to others.
DATA FILTERS

DISPLAY OPTIONS

STATES REPORTING
๐Ÿ—บ
TOTAL CASES
๐Ÿฅ
PEAK YEAR
๐Ÿ“…
TOP STATE
๐Ÿ“
YEAR-OVER-YEAR CHANGE
๐Ÿ“ˆ

Cases Over Time
Loading...

Loading...
Loading...

Full State-wise Data

DATA FILTERS

DISPLAY OPTIONS

TOTAL CASES
๐Ÿฅ
PEAK YEAR
๐Ÿ“…
TOP STATE
๐Ÿ“
TREND DIRECTION
๐Ÿ“Š
State-wise Trend
Loading...
National Rank Over Time
Loading...
National Share of Total Cases
Loading...
State-wise Trend Summary
Loading...
DATA FILTERS

DISPLAY OPTIONS

๐Ÿ”บ
๐Ÿ”ป

State Ranking โ€” Cases
Loading...

Loading...
Case Distribution Map
Loading...
DATA FILTERS

DISPLAY OPTIONS

STATES REPORTING
๐Ÿ—บ
๐Ÿฅ
PEAK YEAR
๐Ÿ“…
MOST AFFECTED STATE
๐Ÿ™๏ธ
YEAR-ON-YEAR CHANGE
๐Ÿ“ˆ

Cases Over Time
Loading...

Geographic Case Distribution
Loading...
Seasonal Pattern โ€” Cases by Month
Loading...

Loading...
Loading...

Full State-wise Data
Loading...

DATA FILTERS

DISPLAY OPTIONS

๐Ÿฅ
PEAK YEAR
๐Ÿ“…
TOP STATE
๐Ÿ“
MOST AFFECTED MONTH
๐Ÿ“†
TREND DIRECTION
๐Ÿ“Š
Loading...
National Rank Over Time
Loading...
National Share of Total Cases
Loading...
State-wise Trend Summary
Loading...
DATA FILTERS

DISPLAY OPTIONS

๐Ÿ”บ
๐Ÿ”ป

State Ranking โ€” Cases
Loading...

Loading...
Seasonal Pattern โ€” Cases by Month
Loading...
DATA FILTERS

DISPLAY OPTIONS

๐Ÿ”บ
๐Ÿ”ป

District Ranking โ€” Cases
Loading...

Loading...
Seasonal Pattern โ€” Cases by Month
Loading...
Adult Vector Collection Sites
Loading...
Suitability Map
Loading...
Threshold Presenceโ€“Absence Map
Loading...
๐ŸฆŸ
What the Vector Bionomics Page Shows
This interactive system displays data derived from a published geospatial modelling study predicting the current and future distribution of Aedine vectors in India based on adult vector collections in published literature.
Left Visualization
๐Ÿ“ Adult Vector Collection Sites
These are point locations where adult mosquitoes were collected, as reported in published articles compiled by the study. Each point on the map corresponds to a study location with confirmed adult vector presence.
Center Visualization
๐Ÿ—บ๏ธ Current Suitability Map
This is a continuous raster surface where each cell has a value representing the predicted environmental suitability for the vector (higher values = more suitable)
Right Visualization
๐Ÿ“‰ Current Threshold Presenceโ€“Absence Map
This is a binary raster derived from the suitability map. Each cell is classified as either โ€œpresenceโ€ (environmentally suitable) or โ€œabsenceโ€ (unsuitable) using a statistical threshold chosen in the study that delineates the ecological niche that the vector occupies.
๐Ÿ”ฌ How the suitability and threshold maps was created (as per the study)
The study used a climate-based ecological niche modelling framework to model the current and projected future distribution of Ae. aegypti and Ae. albopictus . Coordinate occurrence locations of vectors were collected from published literature which reported the exact coordinate locations or locality information of adult vector collections. 19 Bioclimatic variables were used as the predictors of vector suitability. A Maximum Entropy ecological niche model was applied to model the suitability for the two Aedine vectors across India. A maximum true skill statistic (TSS) threshold was then used to delineate the exact ecological niche of the vectors within the environmental suitability raster.

Details of the study methods applied is available via GeoHealth Publication whereas the dataset of vector collection from published literature is available via Dryad Data Archive .
๐Ÿ“Š How to Interpret These Maps
  • Points (vector collections) show where adult vectors were actually observed.
  • The suitability raster shows how favorable the environment is predicted to be across the landscape.
  • The thresholded map shows where conditions cross the modelโ€™s defined suitability cutoff, simplifying interpretation for policy and planning (e.g., potential risk vs no-risk zones).

Dengue Dashboard

NCVBDC Data
National Vector Borne Diseases Control Data
IDSP Data
Integrated Disease Surveillance Programme
Published Data
Reports & Publications
Geographic Distribution of Reported Cases
Loading...
Annual Reported Cases: NCVBDC vs IDSP
Loading...
๐ŸฆŸ

Disease Information

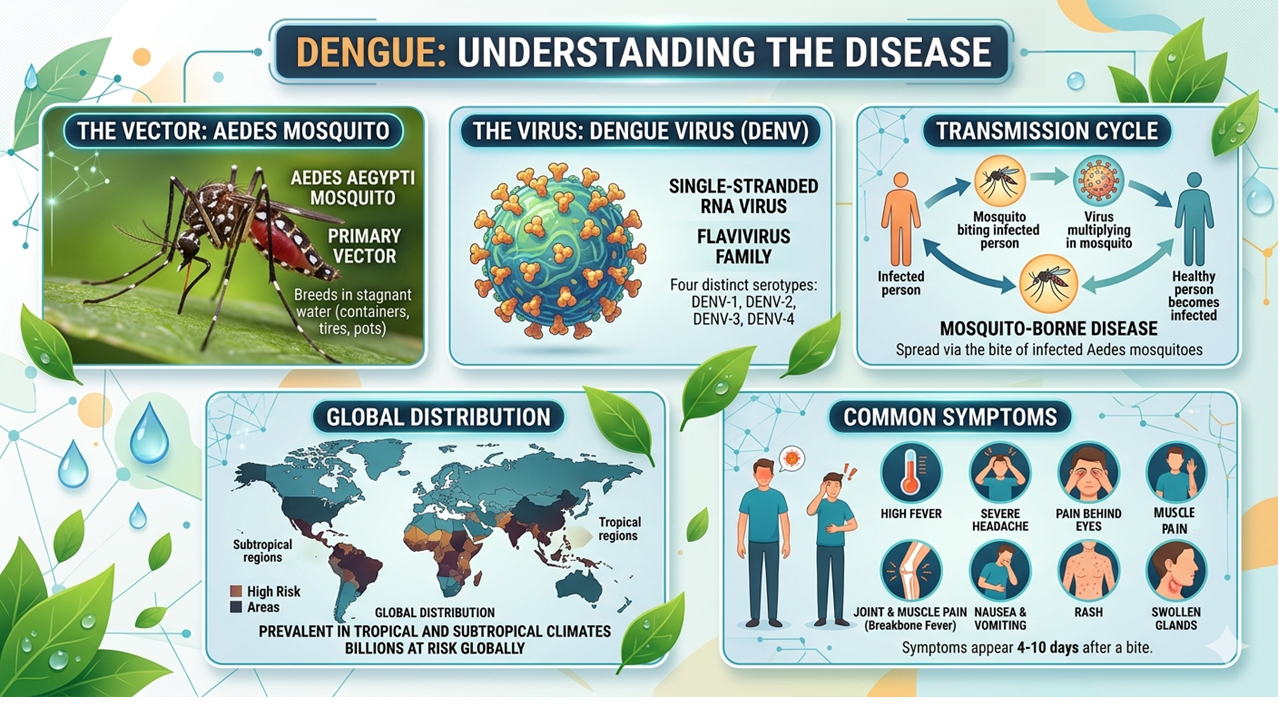
Dengue is one of the fastest-growing viral diseases worldwide. It is caused by the Dengue Virus (DENV) and spread by Aedes mosquitoes. Predominantly found in tropical regions but now threatening half of the global population with around 100โ€“400 million infections every year. Most infected people have no or mild symptoms, but some cases become severe and life-threatening. There is no specific antiviral treatment, and prevention relies mainly on mosquito control. Early diagnosis and supportive care can save lives.

๐ŸฆŸ Vector-borne

Transmitted by Aedes mosquitoes

๐ŸŒ Geographic Spread

Tropical and subtropical regions

๐Ÿค’ Key Symptom

High grade fever

๐Ÿค’

Clinical Symptoms

  • Dengue Infection has mild or no symptoms and gets better in a few weeks.
  • Rarely, it can progress to severe forms such as Dengue Haemorrhagic Fever (DHF) and Dengue Shock Syndrome (DSS) and may also lead to death.
  • If symptoms occur, they usually begin 4โ€“10 days after infection and last for 2โ€“7 days. Symptoms may include High fever (40ยฐC/104ยฐF), severe Headache, Retro-orbital pain, Myalgia and Arthralgia, Nausea, Vomiting, Swollen glands, and Rash.
  • Individuals with secondary infection are at greater risk of severe dengue. The symptoms of severe dengue often come after the fever has gone away and may include severe abdominal pain, persistent vomiting, bleeding gums or nose, fatigue, restlessness, and blood in vomit or stool.
๐Ÿฉบ

Diagnostics and Treatment

  • The available tests include nucleic acid amplification tests (NAATs), enzyme-linked immunosorbent assays (ELISAs), and rapid diagnostic tests (RDTs).
  • There is no specific treatment for dengue; pain can be managed with medication such as paracetamol (acetaminophen).
  • Non-steroidal anti-inflammatory medicines such as ibuprofen and aspirin should be avoided as they can increase the risk of bleeding.
๐ŸฆŸ

Vector

  • Aedes mosquitoes are a vector of dengue fever.
  • It is a small mosquito, black with white stripes, and is approximately 3-5 mm in size.
  • Favorite breeding places include Desert coolers, Drums, Jars, Pots, Buckets, Flower vases, Plant saucers, Tanks, Cisterns, Bottles, Tins, Tyres, Roof gutters, Refrigerator drip pans, Cement blocks, Cemetery urns, Bamboo stumps, Coconut shells, Tree holes, and many more places where rainwater collects or is stored.
๐Ÿ’‰

Vaccines

  • Only one approved vaccine currently: Q-denga (TAK-003).
  • Recommended by WHO for children aged 6โ€“16 years in high-transmission areas.
  • Two-dose schedule: second dose after 3 months.
DATA FILTERS

DISPLAY OPTIONS

STATES REPORTING
๐Ÿ—บ
TOTAL CASES
๐Ÿฅ
PEAK YEAR
๐Ÿ“…
TOP STATE
๐Ÿ“
YEAR-OVER-YEAR CHANGE
๐Ÿ“ˆ

Cases Over Time
Loading...

Loading...
Loading...

Full State-wise Data

DATA FILTERS

DISPLAY OPTIONS

TOTAL CASES
๐Ÿฅ
PEAK YEAR
๐Ÿ“…
TOP STATE
๐Ÿ“
TREND DIRECTION
๐Ÿ“Š
State-wise Trend
Loading...
National Rank Over Time
Loading...
National Share of Total Cases
Loading...
State-wise Trend Summary
Loading...
DATA FILTERS

DISPLAY OPTIONS

๐Ÿ”บ
๐Ÿ”ป

State Ranking โ€” Cases
Loading...

Loading...
Case Distribution Map
Loading...
DATA FILTERS

DISPLAY OPTIONS

STATES REPORTING
๐Ÿ—บ
๐Ÿฅ
PEAK YEAR
๐Ÿ“…
MOST AFFECTED STATE
๐Ÿ™๏ธ
YEAR-ON-YEAR CHANGE
๐Ÿ“ˆ

Cases Over Time
Loading...

Geographic Case Distribution
Loading...
Seasonal Pattern โ€” Cases by Month
Loading...

Loading...
Loading...

Full State-wise Data
Loading...

DATA FILTERS

DISPLAY OPTIONS

๐Ÿฅ
PEAK YEAR
๐Ÿ“…
TOP STATE
๐Ÿ“
MOST AFFECTED MONTH
๐Ÿ“†
TREND DIRECTION
๐Ÿ“Š
Loading...
National Rank Over Time
Loading...
Share of Total Cases
Loading...
State-wise Trend Summary
Loading...
DATA FILTERS

DISPLAY OPTIONS

๐Ÿ”บ
๐Ÿ”ป

State Ranking โ€” Cases
Loading...

Loading...
Seasonal Pattern โ€” Cases by Month
Loading...
DATA FILTERS

DISPLAY OPTIONS

๐Ÿ”บ
๐Ÿ”ป

District Ranking โ€” Cases
Loading...

Loading...
Seasonal Pattern โ€” Cases by Month
Loading...
Point Map
Loading...
Suitability Map
Loading...
Threshold Map
Loading...
๐ŸฆŸ
What the Vector Bionomics Page Shows
This interactive system displays data derived from a published geospatial modelling study predicting the current and future distribution of Aedine vectors in India based on adult vector collections in published literature.
Left Visualization
๐Ÿ“ Adult Vector Collection Sites
These are point locations where adult mosquitoes were collected, as reported in published articles compiled by the study. Each point on the map corresponds to a study location with confirmed adult vector presence.
Center Visualization
๐Ÿ—บ๏ธ Current Suitability Map
This is a continuous raster surface where each cell has a value representing the predicted environmental suitability for the vector (higher values = more suitable)
Right Visualization
๐Ÿ“‰ Current Threshold Presenceโ€“Absence Map
This is a binary raster derived from the suitability map. Each cell is classified as either โ€œpresenceโ€ (environmentally suitable) or โ€œabsenceโ€ (unsuitable) using a statistical threshold chosen in the study that delineates the ecological niche that the vector occupies.
๐Ÿ”ฌ How the suitability and threshold maps was created (as per the study)
The study used a climate-based ecological niche modelling framework to model the current and projected future distribution of Ae. aegypti and Ae. albopictus . Coordinate occurrence locations of vectors were collected from published literature which reported the exact coordinate locations or locality information of adult vector collections. 19 Bioclimatic variables were used as the predictors of vector suitability. A Maximum Entropy ecological niche model was applied to model the suitability for the two Aedine vectors across India. A maximum true skill statistic (TSS) threshold was then used to delineate the exact ecological niche of the vectors within the environmental suitability raster.

Details of the study methods applied is available via GeoHealth Publication whereas the dataset of vector collection from published literature is available via Dryad Data Archive .
๐Ÿ“Š How to Interpret These Maps
  • Points (vector collections) show where adult vectors were actually observed.
  • The suitability raster shows how favorable the environment is predicted to be across the landscape.
  • The thresholded map shows where conditions cross the modelโ€™s defined suitability cutoff, simplifying interpretation for policy and planning (e.g., potential risk vs no-risk zones).

Zika Dashboard

NCVBDC Data
National Vector Borne Diseases Control Data
IDSP Data
Integrated Disease Surveillance Programme
Published Data
Reports & Publications
Geographic Distribution of Reported Cases
Loading...
Annual Reported Cases: IDSP
Loading...
๐ŸฆŸ

Disease Information

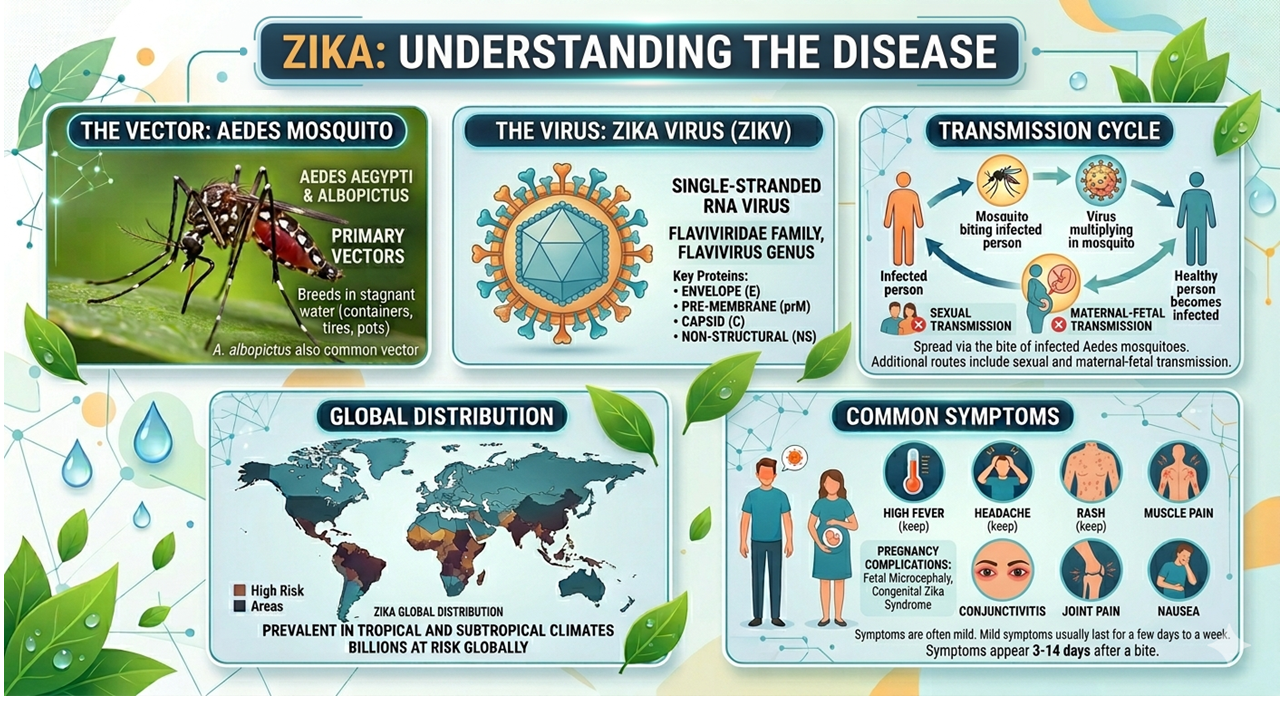
Zika virus is a single-stranded RNA virus belonging to the Flaviviridae family. It was initially discovered in a rhesus monkey in Uganda's Zika forest in 1947. Although the first major documented outbreak occurred on Yap Island in 2007, the pathogen gained global traction during the 2015-2016 epidemic across the Americas. This rapid spread, coupled with an alarming surge in developmental abnormalities in newborns, prompted the World Health Organization (WHO) to declare a Public Health Emergency of International Concern (PHEIC).

๐ŸฆŸ Vector-borne

Transmitted by Aedes mosquitoes

๐ŸŒ Geographic Spread

Tropical and subtropical regions

๐Ÿค’ Key Symptom

High grade fever

๐Ÿค’

Clinical Manifestation

  • The clinical presentation of Zika is frequently subtle, with up to 80% of infected individuals remaining asymptomatic.
  • When illness does occur, symptoms are generally mild and typically last for 2 to 7 days. It presents as a self-limiting febrile disease accompanied by rash, myalgia, arthralgia, and conjunctivitis.
  • However, the virus is infamous for its neurological and teratogenic complications. In adults, infection has been linked to Guillain-Barrรฉ syndrome, a serious autoimmune neuropathy.
  • Even more devastating are the fetal consequences when a woman is infected during pregnancy. The virus can target the developing fetus, leading to congenital Zika syndrome. This encompasses a tragic spectrum of alterations including stillbirth, microcephaly, limited joint movement, and visual impairments.
๐Ÿฉบ

Diagnosis

  • Confirming a suspected Zika infection presents a substantial diagnostic challenge for clinicians.
  • First, because Zika symptoms closely mirror other arboviral diseases like dengue, clinical presentation alone is not enough; laboratory confirmation is required. Second, because the viremic phase is remarkably brief, typically lasting only 3 to 5 days after symptom onset. That is why nucleic acid amplification tests (NAATs or RT-PCR) must be timed perfectly.
  • Once the virus clears from the blood, clinicians must rely on serological testing to detect Zika-specific IgM or IgG antibodies. Unfortunately, these tests are plagued by extensive cross-reactivity with other endemic flaviviruses, most notably the dengue and West Nile viruses.
  • Consequently, positive or equivocal serological results routinely require confirmation via a highly specific plaque reduction neutralization test (PRNT), a method that is time-consuming, labor-intensive, and largely restricted to reference laboratories.
๐ŸฆŸ

Vector and Transmission

  • Zika is principally an arbovirus; it is mainly transmitted to humans through the bite of infected mosquitoes of the Aedes genus (specifically Aedes aegypti and Aedes albopictus).
  • However, epidemiological tracing reveals that mosquito vectors are not the sole route of exposure. The virus exhibits a unique capacity for human-to-human transmission, which includes vertical transmission from mother to fetus, sexual transmission, and spread via blood transfusions or organ transplantation.
  • Furthermore, researchers are actively investigating the persistence of infectious viral particles in breast milk, though the definitive risk of transmission through breastfeeding remains an area of ongoing study.
๐Ÿ’‰

Vaccine

  • Currently, there is no licensed vaccine or specific antiviral available to prevent or treat Zika virus infection.
Official Survey data from NCVBDC not reported
DATA FILTERS

DISPLAY OPTIONS

STATES REPORTING
๐Ÿ—บ
๐Ÿฅ
PEAK YEAR
๐Ÿ“…
MOST AFFECTED STATE
๐Ÿ™๏ธ
YEAR-ON-YEAR CHANGE
๐Ÿ“ˆ

Cases Over Time
Loading...

Geographic Case Distribution
Loading...
Seasonal Pattern โ€” Cases by Month
Loading...

Loading...
Loading...

Full State-wise Data
Loading...

DATA FILTERS

DISPLAY OPTIONS

๐Ÿฅ
PEAK YEAR
๐Ÿ“…
TOP STATE
๐Ÿ“
MOST AFFECTED MONTH
๐Ÿ“†
TREND DIRECTION
๐Ÿ“Š
Loading...
National Rank Over Time
Loading...
National Share of Total Cases
Loading...
State-wise Trend Summary
Loading...
DATA FILTERS

DISPLAY OPTIONS

๐Ÿ”บ
๐Ÿ”ป

State Ranking โ€” Cases
Loading...

Loading...
Seasonal Pattern โ€” Cases by Month
Loading...
DATA FILTERS

DISPLAY OPTIONS

๐Ÿ”บ
๐Ÿ”ป

District Ranking โ€” Cases
Loading...

Loading...
Seasonal Pattern โ€” Cases by Month
Loading...
Point Map
Loading...
Suitability Map
Loading...
Threshold Map
Loading...
๐ŸฆŸ
What the Vector Bionomics Page Shows
This interactive system displays data derived from a published geospatial modelling study predicting the current and future distribution of Aedine vectors in India based on adult vector collections in published literature.
Left Visualization
๐Ÿ“ Adult Vector Collection Sites
These are point locations where adult mosquitoes were collected, as reported in published articles compiled by the study. Each point on the map corresponds to a study location with confirmed adult vector presence.
Center Visualization
๐Ÿ—บ๏ธ Current Suitability Map
This is a continuous raster surface where each cell has a value representing the predicted environmental suitability for the vector (higher values = more suitable)
Right Visualization
๐Ÿ“‰ Current Threshold Presenceโ€“Absence Map
This is a binary raster derived from the suitability map. Each cell is classified as either โ€œpresenceโ€ (environmentally suitable) or โ€œabsenceโ€ (unsuitable) using a statistical threshold chosen in the study that delineates the ecological niche that the vector occupies.
๐Ÿ”ฌ How the suitability and threshold maps was created (as per the study)
The study used a climate-based ecological niche modelling framework to model the current and projected future distribution of Ae. aegypti and Ae. albopictus . Coordinate occurrence locations of vectors were collected from published literature which reported the exact coordinate locations or locality information of adult vector collections. 19 Bioclimatic variables were used as the predictors of vector suitability. A Maximum Entropy ecological niche model was applied to model the suitability for the two Aedine vectors across India. A maximum true skill statistic (TSS) threshold was then used to delineate the exact ecological niche of the vectors within the environmental suitability raster.

Details of the study methods applied is available via GeoHealth Publication whereas the dataset of vector collection from published literature is available via Dryad Data Archive .
๐Ÿ“Š How to Interpret These Maps
  • Points (vector collections) show where adult vectors were actually observed.
  • The suitability raster shows how favorable the environment is predicted to be across the landscape.
  • The thresholded map shows where conditions cross the modelโ€™s defined suitability cutoff, simplifying interpretation for policy and planning (e.g., potential risk vs no-risk zones).